Tag: data center

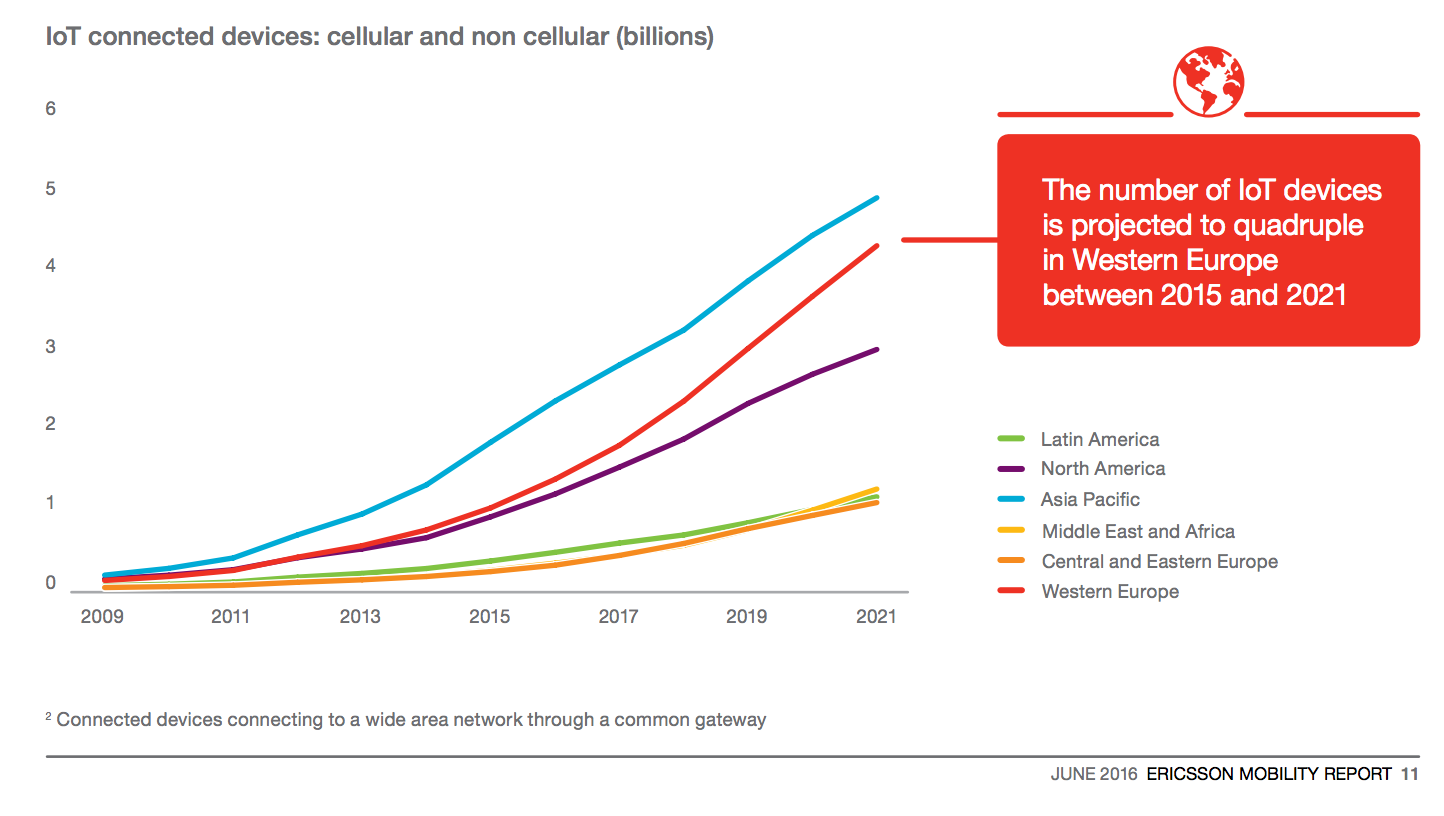
The Internet of Things – trends for the telecoms, data centre, and utility industries

I gave the closing keynote at an event in Orlando last week on the topic of The Impact of the Internet of Things on Telcos, Data Centres, and Utilities.

The slides by themselves can be a little hard to grok, so I’ll go through them below. I should note at the outset that while many of my slide decks can be over 90, or even 100 slides, I kept this one to a more terse 66 😉

And so, here is my explanation of the slides

  1. Title slide
  2. A little about me
  3. The IoT section start
  4. IoT has been around for a while, but the recent explosion in interest in it is down to the massive price drops for sensors, combined with near ubiquitous connectivity – we’re heading to a world where everything is smart and connected
  5. According to the June 2016 Ericsson Mobility Report [PDF], the Internet of Things (IoT) is set to surpass mobile phones as the largest category of connected devices in 2018
  6. Depending on who you believe, Cisco reckons we will have 50bn connected devices by 2020
  7. While IDC puts the number at 212bn connected devices. Whatever the number is, it is going to mean many devices will be creating and transmitting data on the Internet
  8. What kinds of things will be connected? Well, everything from wind turbines (this is an image from GE’s website – they have a suite of IoT apps which can “improve wind turbine efficiency up to 5%” which in a large wind farm is a big deal)
  9. Rio Tinto has rolled out fully autonomous trucks at two of its mines in Australia. They developed the trucks in conjunction with Komatsu. The trucks, which are supervised from a control room 1,000km away in Perth, outperform manned trucks by 12%
  10. A nod to one of my favourite comedy movies (“See the bears game last week? Great game”), while also introducing the next three slides…
  11. Planes – according to Bill Ruh, GE’s CEO of Digital, GE’s jet engines produce 1TB of data per flight. With a typical plane flying 5-10 flights per day, that’s in the region of 10TB per plane per day, and there are 20,00 planes – that’s a lot of data. Plus, GE is currently analysing 50m variables from 10m sensors
  12. Trains – New York Air Brakes has rolled out a sensor solution for trains, which it says is saving its customers $1bn per year
  13. And automobiles – in the 18 months since Tesla starting collecting telemetry data from its customers’ cars, it has collected 780m miles of driving data. It is now collecting another 1 million miles every 10 hours. And the number of miles increases with each new Tesla sold
    And since 2009 Google has collected 1.5m miles of data. This may not sound like much in comparison, but given its data comes from Lidar radars, amongst other sensors, it is likely a far richer data set
  14. With the rollout of smart meters, UK utility Centrica recently announced that it will be going from 75m meter reads a year, to 120bn meter reads per annum
  15. Wearables, like the Fitbit now record our steps, our heartbeat, and even our sleep
  16. This was my heartbeat last November when I presented at the SAP TechEd event in Barcelona – notice the peak at 2:30pm when I went onstage
  17. Lots of in-home devices too, such as smoke alarms, thermostats, lightbulbs, and even security cameras and door locks are becoming smart
  18. Even toy maker Atari has announced that it is getting into the Internet of Things business
  19. Which is leading to an enormous data explosion
  20. In 2012 analyst form IDC predicted that we will have created 40ZB of data by 2020
  21. In 2015 it updated that prediction to 75ZB
  22. Where will this data be created?
  23. Well, according to the 2016 Ericsson Mobility Report, most of the IoT devices will be in Asia Pacific, Western Europe, and North America
  24. When?
  25. That depends, different devices have different data profiles for creation and consumption of data, depending on geography, time of day, and day of year
  26. And why?
  27. Because, as Mary Meeker pointed out in her 2016 State of The Internet report, global data growth has had a +50% CAGR since 2010, while data storage infrastructure costs have had a -20% CAGR in the same timeframe
  28. In 2011 EU Commissioner Neelie Kroes famously said that Data is the new gold
  29. And if that’s true, as is the case with any gold rush, the real money is to be made supplying the prospectors
  30. Now, let’s look at some of the trends and impacts in the telecoms industry
  31. From Ericsson’s 2016 Mobility Report we can see that the big growth for the telecoms is in data traffic
  32. And not content to be merely infrastructure providers, telcos are looking to climb the value chain
  33. To facilitate this data explosion, telecom companies are building fatter pipes with LTE growing significantly in numbers between 2015 and 2021, while 2019 will see 5G kicking off
  34. Telcos are now offering cloud solutions. Their USP being that their cloud is fast, reliable, and end-to-end secure
  35. There are huge opportunities for telcos in this space
  36. In the next few slides I did a bit of a case study of AT&T, and some of the ways it is leveraging the Internet of Things. First off AT&T has partnered with solar company SunPower to connect residential solar panels for remote monitoring of the panels’ performance
  37. In its connected vehicle portfolio, AT&T manage the connections for Tesla, Audi, GM, and Uber. They have 8m connected cars atm, and expect to grow that to 10m by the end of 2017
  38. And, an interesting data point to back that up – in the first quarter of 2016, in the US, 32% of all new cellular connections were for cars. The largest percentage of any segment
  39. 243,000 refrigerated shipping containers connected through AT&T

  40. AT&T have a partnership with GE for intelligent lighting solutions for cities and public roadways
  41. In the equipment and heavy machinery space, nearly half of all tractors and harvesters in the US are connected through AT&T
  42. While in healthcare, AT&T predicts that wellness tracking and virtual care solutions will reach 60m homes & 74m users by 2019
  43. Then there’s outdoor advertising. AT&T knows data analysis. For years they owned the largest telemarketing organisation in the US. Now, with cellular data, they can completely transform outdoor advertising. Previously for advertising hoardings, the amount of footfall, or vehicular traffic passing a sign could be guesstimated, but no more info than that was available. But now, because AT&T knows where everyone is, their gender, age, and approximate income, they can transform this business.
    Recently they carried out a study with a customer who wanted to advertise to women in the Dallas area who earned over $75,000 per year. They queried the data and found that the customer only needed to buy two billboards in all of Dallas, to adequately cover the target demographic. Needless to say the customer was impressed
  44. Because they don’t have a monopoly on ideas, AT&T have opened up their M2X Internet of Things developer platform to allow outside developers create solutions using AT&T’s infrastructure
  45. They’re far from being alone in this – Verizon have an Internet of Things platform as well called ThingSpace Develop
  46. While t-mobile has announced that it is teaming up with Twilio for its Internet of Things play
  47. And it is not just cellular technologies they are using – there are also other low bandwidth radio protocols such as Lora and Sigfox which the telcos are looking at to broaden their reach
  48. I spoke to a senior exec at a telcom firm recently (who for obvious reasons preferred to remain unnamed) and he told me:
    Telcos want to own everything, everywhere“The internet of things is certainly one way for them to get there
  49. How is all this impacting the data centre industry?
  50. Well, in the next four years data centre capacity will need to increase 750% according to IDC. Also required will be significant ramp-ups in analytics, security and privacy
  51. As Jim Gray pointed out in his book The Fourth Paradigm:

    “As datasets grow ever larger, the most efficient way to perform most of these computations is clearly to move the analysis functions as close to the data as possible”

    In other words, instead of bringing all the data back to the data centre to be processed, more and more of the analysis will need to be performed at the edge

  52. As a graduate biologist, this reminds me of the reflex arc – this arc allows reflex actions to occur relatively quickly by activating spinal motor neurons, without the delay of routing signals through the brain
  53. So there will be a greater need for event stream processing outside the data centre – this will bring about faster responsiveness, and reduce storage requirements
  54. This also explains the rise of companies such as EdgeConnex – companies who provide proximity, and lower latency
  55. And the rise of new designs of racks for hyperscale computing, such as the 150kW Vapor.io Vapor Chamber which, according to a study conducted by Romonet is $3m cheaper per MW and reclaims 25% of floor space
  56. Other initiatives in the industry include Google’s attempting to create a new standard for HDD’s to make them taller, adding more platters, and thus increasing IOPs
  57. Microsoft and Facebook are getting together with Telefonica to build a 160TB transatlantic fibre cable (the largest to-date) to handle the vast streams of data they see coming
  58. While Intel are warning that organisations need to become more security aware, as more devices become connected
  59. I also decided to address a trend in data centres to require renewable energy from their utility providers, and did so by referencing this excellent letter from Microsoft General Counsel Brad Smith on the topic (recommended reading)
  60. Finally, what about the utilities sector…
  61. Well, there are many ways the internet of Things will impact the utilities vertical, but one of the least obvious, but most impactful ones will be the ability to move energy demand, to more closely match supply. If you’re curious about this, I’ve given 45 minute keynotes on this topic alone
  62. Another way the Internet of Things will help utilities is renewables management (such as the GE example referenced earlier), and preventative maintenance applications
  63. And finally, energy information services will be a big deal, for everything from remote monitoring for seniors, through to device maintenance, and home management
  64. The conclusions
  65. Thanks
  66. Any questions?

I received extremely positive feedback on the talk from the attendees. If you have any comments/questions, feel free to leave them in the comments, email me (tom@tomraftery.com), or hit me up on Twitter, Facebook, or LinkedIn.

Equinix rolls out 1MW fuel cell for Silicon Valley data center

Equinix Silicon Valley Data Center

Equinix is powering one of its Silicon Valley data centers with a 1MW Bloom Energy fuel cell

As we have pointed out here many times, the main cloud providers (particularly Amazon and IBM) are doing a very poor job either powering their data centers with renewable energy, or reporting on the emissions associated with their cloud computing infrastructure.

Given the significantly increasing use of cloud computing by larger organisations, and the growing economic costs of climate change, the sources of the electricity used by these power-hungry data centers is now more relevant than ever.

Against this background, it is impressive to see to see Equinix, a global provider of carrier-neutral data centers (with a fleet of over 100 data centers) and internet exchanges, announce a 1MW Bloom Energy biogas fuel cell project at its SV5 data center, in Silicon Valley. Biogas is methane gas captured from decomposing organic matter such as that from landfills or animal waste.

Why would Equinix do this?

Well, the first phase of California’s cap and trade program for CO2 emissions commenced in January 2013, and this could, in time lead to increased costs for electricity. Indeed in their 2014 SEC filing [PDF], Equinix note that:

The effect on the price we pay for electricity cannot yet be determined, but the increase could exceed 5% of our costs of electricity at our California locations. In 2015, a second phase of the program will begin, imposing allowance obligations upon suppliers of most forms of fossil fuels, which will increase the costs of our petroleum fuels used for transportation and emergency generators.

We do not anticipate that the climate change-related laws and regulations will force us to modify our operations to limit the emissions of GHG. We could, however, be directly subject to taxes, fees or costs, or could indirectly be required to reimburse electricity providers for such costs representing the GHG attributable to our electricity or fossil fuel consumption. These cost increases could materially increase our costs of operation or limit the availability of electricity or emergency generator fuels.

In light of this, self-generation using fuel cells looks very attractive, both from the point of view of energy cost stability, and reduced exposure to increasing carbon related costs.

On the other hand, according to today’s announcement, Equinix already gets approximately 30% of its electricity from renewable sources, and it plans to increase this to 100% “over time”.

Even better than that, Equinix is 100% renewably powered in Europe despite its growth. So Equinix is walking the walk in Europe, at least, and has a stated aim to go all the way to 100% renewable power.

What more could Equinix do?

Well, two things come to mind immediately:

  1. Set an actual hard target date for the 100% from renewables and
  2. Start reporting all emissions to the CDP (and the SEC)

Given how important a player Equinix in the global internet infrastructure, the sooner we see them hit their 100% target, the better for all.

Why are Salesforce hiding the emissions of their cloud?

Salesforce incorrect carbon data
The lack of transparency from Cloud computing providers is something we have discussed many times on this blog – today we thought we’d highlight an example.

Salesforce dedicates a significant portion of its site to Sustainability and on “Using cloud computing to benefit our environment”. They even have nice calculators and graphs of how Green they are. This all sounds very promising, especially the part where they mention that you can “Reduce your IT emissions by 95%”, so where is the data to back up these claims? Unfortunately, the data is either inaccurate or missing altogether.

For example, Salesforce’s carbon calculator (screen shot above) tells us that if an organisation based in Europe moves its existing IT platform (with 10,000+ users) to the Salesforce cloud, it will reduce its carbon emissions by 87%.

This is highly suspect. Salesforce’s data centers are in the US (over 42% of electricity generated in the US comes from coal) and Singapore where all but 2.6% of electricity comes from petroleum and natural gas [PDF].

On the other hand, if an organisation’s on premise IT platform in Europe is based in France, it is powered roughly 80% by nuclear power which has a very low carbon footprint. If it is based in Spain, Spain generates almost 40% of its power from renewables [PDF]. Any move from there to Salesforce cloud will almost certainly lead to a significant increase in carbon emissions, not a reduction, and certainly not a reduction of 87% as Salesforce’s calculator claims above.

Salesforce incorrect carbon data

Salesforce also has a Daily Carbon Savings page. Where to start?

To begin with, the first time we took a screen shot of this page was on October 1st for slide 26 of this slide deck. The screen shot on the right was taken this morning. As you can see, the “Daily Carbon Savings” data hasn’t updated a single day in the meantime. It is now over two months out-of-date. But that’s probably just because of a glitch which is far down Salesforce’s bug list.

The bigger issue here is that Salesforce is reporting on carbon savings, not on its carbon emissions. Why? We’ve already seen (above) that their calculations around carbon savings are shaky, at best. Why are they not reporting the much more useful metric of carbon emissions? Is it because their calculations of emissions are equally shaky? Or, is it that Salesforce are ashamed of the amount of carbon they are emitting given they have sited their data centers in carbon intensive areas?

We won’t know the answer to these questions until Salesforce finally do start reporting the carbon emissions of its cloud infrastructure. In a meaningful way.

Is that likely to happen? Yes, absolutely.

When? That’s up to Salesforce. They can choose to be a leader in this space, or they can choose to continue to hide behind data obfuscation until they are forced by either regulation, or competitive pressure to publish their emissions.

If we were Salesforce, we’d be looking to lead.

Image credits Tom Raftery

Enhanced by Zemanta

(Cross-posted @ GreenMonk: the blog)

The Switch SuperNAP data centre – one of the most impressive I’ve been in

Switch SuperNAP data centre
If you were going to build one of the world’s largest data centre’s you wouldn’t intuitively site it in the middle of the Nevada desert but that’s where Switch sited their SuperNAPs campus. I went on a tour of the data centre recently when in Las Vegas for IBM’s Pulse 2012 event.

The data centre is impressive. And I’ve been in a lot of data centre’s (I’ve even co-founded and been part of the design team of one in Ireland).

The first thing which strikes you when visiting the SuperNAP is just how seriously they take their security. They have outlined their various security layers in some detail on their website but nothing prepares you for the reality of it. As a simple example, throughout our entire guided tour of the data centre floor space we were followed by one of Switch’s armed security officers!

The data centre itself is just over 400,000 sq ft in size with plenty of room within the campus to build out two or three more similarly sized data centres should the need arise. And although the data centre is one of the world’s largest, at 1,500 Watts per square foot it is also quite dense as well. This facilitates racks of 25kW and during the tour we were shown cages containing 40 x 25kW racks which were being handled with apparent ease by Switch’s custom cooling infrastructure.

Switch custom cooling infrastructure

Because SuperNAP wanted to build out a large scale dense data centre, they had to custom design their own cooling infrastructure. They use a hot aisle containment system with the cold air coming in from overhead and the hot air drawn out through the top of the contained aisles.

The first immediate implication of this is that there are no raised floors required in this facility. It also means that walking around the data centre, you are walking in the data centre’s cold aisle. And as part of the design of the facility, the t-scif’s (thermal seperate compartment in facility – heat containment structures) are where the contained hot aisle’s air is extracted and the external TSC600 quad process chillers systems generate the cold air externally for delivery to the data floor. This form of design means that there is no need for any water piping within the data room which is a nice feature.

Through an accident of history (involving Enron!) the SuperNAP is arguably the best connected data centre in the world, a fact they can use to the advantage of their clients when negotiating connectivity pricing. And consequently, connectivity in the SuperNAP is some of the cheapest available.

As a result of all this, the vast majority of enterprise cloud computing providers have a base in the SuperNAP. As is the 56 petabyte ebay hadoop cluster – yes, 56 petabyte!

US electricity generation

Given that I have regularly bemoaned cloud computing’s increasing energy and carbon footprint on this blog, you won’t be surprised to know that one of my first questions to Switch was about their energy provider, NV Energy.

According to NV Energy’s 2010 Sustainability Report [PDF] coal makes up 21% of the generation mix and gas accounts for another 63.3%. While 84% electricity generation from fossil fuels sounds high, the 21% figure for coal is low by US standards, as the graph on the right details.

Still, it is a long way off the 100% of electricity from renewables that Verne Global’s new data centre has.

Apart from the power generation profile, which in fairness to Switch, is outside their control (and could be considerably worse) the SuperNAP is, by far, the most impressive data centre I have ever been in.

Photo Credit Switch

by-sa

Carbon Disclosure Project’s emissions reduction claims for cloud computing are flawed

data center
The Carbon Disclosure Project (CDP) is a not-for-profit organisation which takes in greenhouse gas emissions, water use and climate change strategy data from thousands of organisations globally. This data is voluntarily disclosed by these organisations and is CDP’s lifeblood.

Yesterday the CDP launched a new study Cloud Computing – The IT Solution for the 21st Century a very interesting report which

delves into the advantages and potential barriers to cloud computing adoption and gives insights from the multi-national firms that were interviewed

The study, produced by Verdantix, looks great on the surface. They have talked to 11 global firms that have been using cloud computing for over two years and they have lots of data on the financial savings made possible by cloud computing. There is even reference to other advantages of cloud computing – reduced time to market, capex to opex, flexibility, automation, etc.

However, when the report starts to reference the carbon reductions potential of cloud computing it makes a fundamental error. One which is highlighted by CDP Executive Chair Paul Dickinson in the Foreword when he says

allowing companies to maximize performance, drive down costs, reduce inefficiency and minimize energy use – and therefore carbon emissions

[Emphasis added]

The mistake here is presuming a direct relationship between energy and carbon emissions. While this might seem like a logical assumption, it is not necessarily valid.

If I have a company whose energy retailer is selling me power generated primarily by nuclear or renewable sources for example, and I move my applications to a cloud provider whose power comes mostly from coal, then the move to cloud computing will increase, not decrease, my carbon emissions.

The report goes on to make some very aggressive claims about the carbon reduction potential of cloud computing. In the executive summary, it claims:

US businesses with annual revenues of more than $1 billion can cut CO2 emissions by 85.7 million metric tons annually by 2020

and

A typical food & beverage firm transitioning its human resources (HR) application from dedicated IT to a public cloud can reduce CO2 emissions by 30,000 metric tons over five years

But because these are founded on an invalid premise, the report could just as easily have claimed:

FaceBook open sources building an energy efficient data center

FaceBook's new custom-built Prineville Data Centre

(Photo credit FaceBook’s Chuck Goolsbee)

Back in 2006 I was the co-founder of a Data Centre in Cork called Cork Internet eXchange. We decided, when building it out, that we would design and build it as a hyper energy-efficient data centre. At the time, I was also heavily involved in social media, so I had the crazy idea, well, if we are building out this data centre to be extremely energy-efficient, why not open source it? So we did.

We used blogs, flickr and video to show everything from the arrival of the builders on-site to dig out the foundations, right through to the installation of customer kit and beyond. This was a first. As far as I know, no-one had done this before and to be honest, as far as I know, no-one since has replicated it. Until today.

Today, Facebook is lifting the lid on its new custom-built data centre in Prineville, Oregon.

Not only are they announcing the bringing online of their new data centre, but they are open sourcing its design, specifications and even telling people who their suppliers were, so anyone (with enough capital) can approach the same suppliers and replicate the data centre.

Facebook are calling this the OpenCompute project and they have released a fact sheet [PDF] with details on their new data center and server design.

I received a pre-briefing from Facebook yesterday where they explained the innovations which went into making their data centre so efficient and boy, have they gone to town on it.

Data centre infrastructure
On the data centre infrastructure side of things, building the facility in Prineville, Oregon (a high desert area of Oregon, 3,200 ft above sea level with mild temperatures) will mean they will be able to take advantage of a lot of free cooling. Where they can’t use free cooling, they will utilise evaporative cooling, to cool the air circulating in the data centre room. This means they won’t have any chillers on-site, which will be a significant saving in capital costs, in maintenance and in energy consumption. And in the winter, they plan to take the return warm air from the servers and use it to heat their offices!

By moving from centralised UPS plants to 48V localised UPS’s serving 6 racks (around 180 Facebook servers), Facebook were able to re-design the electricity supply system, doing away with some of the conversion processes and creating a unique 480V distribution system which provides 277V directly to each server, resulting in more efficient power usage. This system reduces power losses going in the utility to server chain, from an industry average 21-27% down to Prineville’s 7.5%.

Finally, Facebook have significantly increased the operating temperature of the data center to 80.6F (27C) – which is the upper limit of the ASHRAE standards. They also confided that in their next data centre, currently being constructed in North Carolina, they expect to run it at 85F – this will save enormously on the costs of cooling. And they claim that the reduction in the number of parts in the data center means they go from 99.999% uptime, to 99.9999% uptime.

New Server design…

Sentilla thinks of data centers, as data factories!

Data center
If you have been following this blog, you’ll know I have been profiling Data Center efficiency companies over the last few weeks. This week I take a look at Sentilla.

I talked to Sentilla’s CTO and co-founder, Joe Polastre, the other day and Joe told me that Sentilla came out of Berkeley where they had been looking at data analytics problems around large, potentially incomplete or inaccurate, streaming datasets. The challenge was how to turn that into a complete picture of what’s going on so people could make business decisions.

Sentilla takes an industrial manufacturing approach to Data Centers – in manufacturing you have power going in one side, and products and (often) waste heat coming out the other. In the same way in data centers you have power going in one side and coming out the other side you have the product (compute cycles) and waste heat. To optimise your data center you need to get the maximum data/compute (product) output with the minimum power in and the least waste heat generated. Sentilla thinks of data centers, as data factories!

Unlike most of the data center people I have talked to, Sentilla don’t talk so much about energy savings. Instead they emphasise maximising performance – getting the most out of your existing data centers, your existing storage, your existing servers, your existing power supply. By far the greatest saving from deploying Sentilla, Joe claimed, is not from the energy savings. That pales in comparison to the capital deferment savings gained from being able to delay the building of extra data center facilities by however many years, he said.

So how does Sentilla help?

Well Sentilla analyses the energy profile of every asset in the data center, whether metered or not, and makes recommendations to improve the planning and management of data center operations…

Power Assure automates the reduction of data center power consumption

Data centre
If you’ve been following this blog in the last couple of weeks you’ll have noticed that I have profiled a couple of data centre energy management companies – well, today it is the turn of Power Assure.

The last time I talked to Power Assure was two years ago and they were still very early stage. At that time I talked to co-founder and CTO, Clemens Pfeiffer, this time I spoke with Power Assure’s President and CEO, Brad Wurtz.

The spin that Power Assure put on their energy management software is that, not only do they offer their Dynamic Power Management solution which provides realtime monitoring and analytics of power consumption across multiple sites, but their Dynamic Power Optimization application automatically reduces power consumption.

How does it do that?

Well, according to Brad, clients put an appliance in each of the data centres they are interested in optimising (Power Assure’s target customer base are large organisations with multiple data centres – government, financial services, healthcare, insurance, telco’s, etc.). The appliance uses the management network to gather data – data may come from devices (servers, PDU’s, UPS’s, chillers, etc.) directly, or more frequently, it gathers data directly from multiple existing databases (i.e. a Tivoli db, a BMS, an existing power monitoring system, and/or inventory system) and performs Data Centre analytics on those data.

The optimisation module links into existing system management software to measures and track energy demand on a per applications basis in realtime. It then calculates the amount of compute capacity required to meet the service level agreements of that application and adds a little bit of headroom…

SAP’s Palo Alto energy efficiency and CO2 reductions

Cisco Telepresence

As mentioned previously, I was in Santa Clara and Palo Alto last week for a couple of SAP events.

At these events SAP shared some of its carbon reduction policies and strategies.

According to SAP Chief Sustainability Officer Peter Graf, the greatest bang for buck SAP is achieving comes from the deployment of telepresence suites. With video conferencing technologies SAP is saving €655 per ton of CO2 saved. This is hardly surprising given Cisco themselves claim to have saved $790m in travel expenditure from their telepresence deployments!

Other initiatives SAP mentioned were the installation of 650 solar panels on the roof of building 2 which provides for around 5-6% of SAP’s Palo Alto energy needs. This means that on sunny days, the SAP Palo Alto data centre can go completely off-grid. The power from the solar panels is not converted to AC at any point – instead it is fed directly into the data centre as DC – thereby avoiding the normal losses incurred in the conversion from DC->AC->DC for computer equipment. Partnerships with OSISoft and Sentilla ensure that their data centre runs at optimum efficiency.

SAP also rolled out 337 LED lighting systems. These replaced fluorescent lighting tubes and because the replacement LED lights are extremely long-life, as well as low energy, there are savings on maintenance as well as electricity consumption.

Coulomb electric vehicle charging station at SAP HQ in Palo Alto

SAP has placed 16 Coulomb level two electric vehicle charging stations around the car parks in its facility. These will allow employees who purchase electric vehicles to charge their cars free of charge (no pun!) while they are at work. SAP has committed to going guarantor on leases for any employees who plan to purchase electric vehicles. We were told to watch out for a big announcement from SAP in January in the electric vehicle space!

NightWatchman Server Edition

Grassy server room!
Photo via Tom Raftery

In a bid to help companies tackle server sprawl, 1E launched v2.0 of its NightWatchman Server Edition yesterday.

1E’s NightWatchman software comes in two flavours – the desktop edition to allow for central administration of the power management of laptops and desktops (including Macs) and the server edition.

The power consumption of desktop computers, which are often only used 8 hours a day, (and may need to be woken up once a month at 3am for an update) is relatively straightforward to manage. On the other hand, the power management of servers is quite a bit more complex. Servers are, by definition supposed to be accessible at all times, so you can’t shut them down, right?

Well, yes and no.

Not all servers are equal. Up to 15% of servers globally are powered on, and simply doing nothing. This equates to roughly $140 billion in power costs and produces 80 million tons of carbon dioxide annually.

Nightwatchman helps in a number of ways. First, its agent-based software quickly identifies servers whose CPU utilisation is is simply associated with its own management and maintenance processes (i.e. the server is unused). These servers can be decomissioned or repurposed…